


")


检测系统的焦距,监测产品使用环境的温度状况;
比较多个灯的特征;
比较单个UV系统在不同时间的表现,或者比较不同系统;
使用PowerView软件查看、分析、操作、储存数据(数据以图表方式显示和储存)
Featur (Benefits) :-
| Application :-
|
Introduion
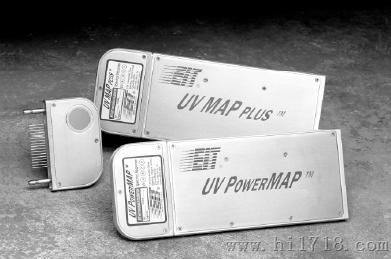
EIT's UV PowerMAP and UV MAP Plus are advanced measurement systems that measure and store UV energy, UV irradiance, and temperature information derived from their optics and thermocouple prob in UV curing procs. The UV PowerMAP simultaneously measur all four UV channels while the UV MAP Plus measur one channel.
The information is transferred to a PC where it is prented in graph and data format for viewing and ysis. The information is charaeristic of the same energy and irradiance that would be impinged on an aual work piece ping through the curing procs.
The UV PowerMAP and the UV MAP Plus are the ultimate tools for developing, monitoring, and maintaining UV curing procs. UV formulators, raw material suppliers, and equipment suppliers can take advantage of the UV PowerMAP's ability to measure all four UV channels to develop procs that are easily transferred from a laboratory to a produion environment. The UV MAP Plus monitors the one UV channel specified (A, B, C, or V) when it is ordered. The UV MAP Plus was digned more for use on a produion floor, and it is an economical alternative to the UV PowerMAP. With the PowerView software, the UV PowerMAP and the UV MAP Plus offer far greater rolution, data sampling, data storage, and data manipulation than previously available in mapping systems.
Variabl such as refleor materials, refleor shap, wavelength-specific refleor degradation and uniformity, and lamp focus can be documented. Compani using multi-lamp curing systems and those that are using different speral lamps within a system will find the radiometers indispensable.
The UV PowerMAP and UV MAP Plus systems are composed of a data colleion unit, detachable optic measurement head, and PowerView software package. The units measure UV energy in Joul/cm2 and UV irradiance in Watts/cm2. With PowerView, UV sample rat are adjusted from 128 to 2048 sampl per second to match rolution and information requirements.
PowerView uploads and displays the colleed UV system data, unit configurations, and time/date stamps. This data is saved as a computer file that can be manipulated, customized, and exported into a spreadsheet by the user so the entire UV system can be evaluated.
Operation
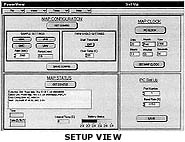
The UV PowerMAP and UV MAP Plus are initially configured at the faory before they are shipped. Settings are easily viewed and changed in a Setup screen in PowerView. In Setup, the user can set the unit's configuration to match the lamp system and get the dired data. The channels that are enabled, the time and date settings, port settings, and the UV sample rate are easily changed with the click of a mouse. The unit's maximum sample rate of 2048 sampl/second and its ability to store up to I million data points ensur accurate and sharp rolution - even at high speeds.
The user inserts the unit into a stationary or conveyorized UV procs for data colleion in the same manner that an aual work piece would be inserted. The unit's low, narrow profile of only 0.5"H x 3.5"W allows usage in a wide range of demanding physical environments. The unit's optics are offset so it can colle data at the ends of the bulbs where lamp degradation tends to occur first.

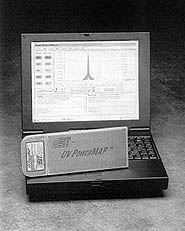
Upon exiting from the curing environment, the unit is conneed to a PC serial port via cable so that the "run" information can be uploaded into the PowerView application software.
The data transfer is initiated in PowerView's Transfer View screen, where the unit configuration and transfer progrs are displayed. The user can enter information such as line speed, amp readings, lamp settings, t of bulbs, and any other information relevant to the run. The user can also see a preliminary view of the plot. A detailed look at the plot is available after the transfer is complete.
PowerView shows the status of a curing system in a clear, easy to read format. The user can see which lamps and refleors in a system are well focused and performing most efficiently. PowerView's ability to compare two different runs is one of its most important featur. The run data fil are referred to as a "Sample" file and a "Reference" file.

PowerView's Graph View screen shows the UV irradiance and temperature data for the runs in graphical form. The user can toggle the display of the temperature and any of the UV channels (for PowerMAP) either on or off. Graph View has a zoom feature to enlarge any portion of the plot, and cursor measurement for detailed ysis. The user can change the appearance or color of a curve, and a data-oothing filter is available to improve plot viewing.
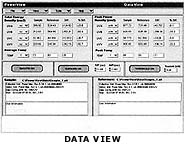
The Data View screen lists the total energy density (J/cm2) and the peak power density (W/cm2) for each aive speral channel. The average temperature and peak temperature readings colleed by the thermocouple are also prented. If two fil are open, Data View shows the differenc between readings as absolute valu and as percentag. Logged information and user-entered information is also displayed for both run fil.
A Te J thermocouple probe is used for substrate temperature measurement. Temperatur from 0° to 500°C are recorded at 32 sampl per second. This is an important funion if curing is taking place on temperature sensitive substrat.
An over-temperature alarm alerts the user when the unit's internal temperature exceeds 65°C. This giv the user time to remove the unit from a thermally hostile environment before it overheats.
The UV PowerMAP and the UV MAP Plus are powered by nickel metal hydride (NiMH) batteri, which can be recharged approximately 500 tim before needing replacement. An audible alarm sounds when the batteri need recharging.
Routine maintenance for the units consists of battery charging, cleaning, and returning the optics heads for routine calibration. Recharging is accomplished by a one-hour "quick" charge.
Keeping the optics clean is sential for getting proper measurement rults, and it requir only cotton swabs and acetone. The case can be cleaned with isopropyl alcohol and a soft cloth.
Since the optics head disconnes from the DCU, only the optics head has to be returned for periodic calibration. It is conneed to the colleion unit by two mechanical pins and a row of elerical contas, and locked into place by two setscrews. Another optics head may be purchased to avoid down time during recalibration or to upgrade from single to four-channel capability.
Summary
The UV PowerMAP and the UV MAP Plus have an enormous advantage over other UV measurement instruments on the market. Both allow the user to evaluate the entire lamp system to see how well it delivers UV light to the aual cure surface. Focused lamp systems with good refleors tically cure more efficiently which is important considering that as much as 75% of the energy reaching the cure surface is reeleed energy.
The colleed data allows the user to adjust the curing procs to ensure that the UV system is operating at maximum efficiency.
The data that is graphed can be archived for future reference or printed and attached to work orders for ISO or FDA audits. The historical data can be used to make comparisons between current runs and previous runs. UV lamps within a system can be compared to each other, or entirely different UV systems can be yzed and compared.
EIT PowerMap能量计


